Research Article - International Journal of Chemical and Pharmaceutical Analysis ( 2022) Volume 10, Issue 1
DEVELOPMENT AND VALIDATION OF RP-HPLC METHOD FOR THE SIMULTANEOUS ESTIMATION OF LOSARTAN POTASSIUM AND HYDROCHLORTHIAZIDE IN BULK AND TABLET DOSAGE FORM
N.Vivekanandan*, N.Santhi, S.S.Rajendran and S.Suresh KumarN.Vivekanandan, Department of Pharmaceutical Analysis, RVS College of Pharmaceutical Sciences, Coimbatore, Tamil nadu, India, Email: vivekvignesh1541998@gmail.com
Received: 04-Mar-2022, Manuscript No. IJCPA-22-56219; Editor assigned: 07-Mar-2022, Pre QC No. IJCPA-22-56219(PQ); Reviewed: 21-Mar-2022, QC No. IJCPA-22-56219; Revised: 28-Mar-2022, Manuscript No. IJCPA-22-56219(R); Published: 07-Apr-2022, DOI: 10.21276/2395-2466.22.10.0073
Abstract
The day by day new combinations drugs are being launched in market. Then the multiple therapeutic agents which acts at diverse sites are used in the management of various diseases and disorders are done. Thus it is necessary to develop methods for analysis with the help of number of analytical methods which are available for the estimation of the drugs in combination. The analyst were estimate the rapid, selective, specific, simple, RP-HPLC method is developed and validated for simultaneous estimation of Losartan potassium and Hydrochlorthiazide in pharmaceutical tablet dosage form. RP-HPLC method was performed on the HPLC System with UV-VIS detector and Nucleodur,C8 (150 mm × 3.9 mm, 5 μm), using the mobile phase (Acetonitrile: Buffer B (7:93 v/v) pH 7.0 to 7.5 with 0.05% at a flow rate of 1.0 ml/min, injection volume 20 μl and UV detection at 280 nm. This method is validated according to BP, USP and ICH requirements for new methods, which include accuracy, precision, robustness, ruggedness, linearity and range. Linear relationships were obtained in the ranges of 100-300 μg/ml and 50-150 μg/ml with correlation coefficients of 0.9999 and 0.9996 at Rt value of 10.769 min and 21.633 min for Losartan potassium and hydrochlorthiazide respectively. According to ICH guidelines the developed method was validated. The proposed method can be used for estimation of these drugs in combined pharmaceutical dosage forms.
Keywords
Losartan potassium, Hydrochlorthiazide, RP-HPLC, Development, Validation
Introduction
The pharmaceutical formulations with combinations of drugs have shown an increasing trend to counteract the symptoms specific to one drug and formulation, and hence analytical chemist will have to accept the challenge of developing reliable and easy simultaneous methods because it does not require manual individual calculations and marginally give better results [1].
Theophylline (1,3 dimethyl, 2-3-6-7-tetrahydro-1-H Purine-2,6- dione. Theophylline is Xanthine dr. which is used for the treatment of asthma and bronchial obstructive diseases. It acts competitively inhibiting the Type 3 and Type 4 phosphodiesterase, the enzyme responsible for breaking down the cyclic AMP in smooth muscle cells, possibly resulting in bronchodilation.
Losartan potassium
The chemical name of Losarta potassium is: potassium;[2-butyl-5-chloro-3-[[4-[2-(1,2,4-triaza-3-azanidacyclopenta-1,4- dien-5- yl)phenyl]phenyl]methyl]imidazol-4-yl]methanol. It has a molecular formula of C22H22ClKN6O and the molecular weight of 461.0 gm/mol. Generously it is freely soluble in water and soluble in alcohols. It has the structural formula shown in Figure 1 [2-4].
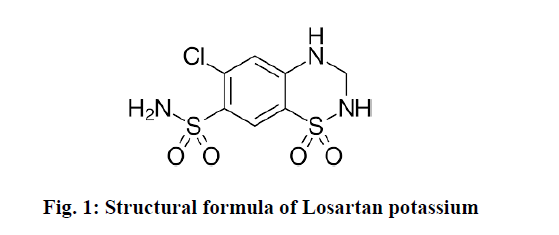
Figure 1: Structural formula of Losartan potassium
Hydrochlorthiazide
The chemical name is 6-chloro-1,1-dioxo-3,4-dihydro-2H-1λ6,2,4-benzothiadiazine-7-sulfonamide. It has the molecular formula of C7H8ClN3O4S2 and molecular weight of 297.7 gm/mol. It is soluble in sodium hydroxide solution, in n-butyl amine, and in dimethylformamide. It has the structural formula shown in Figure 2.
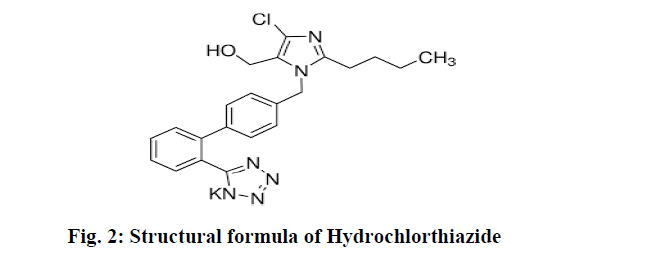
Figure 2: Structural formula of Hydrochlorthiazide
Mechanism of action: Hydrochlorothiazide is transported from the circulation into epithelial cells of the distal convoluted tubule by the organic anion transporters OAT1, OAT3, and OAT4 From these cells, hydrochlorothiazide is transported to the lumen of the tubule by multidrug resistance associated protein 4 (MRP4)1-7.
Materials and Methods
Apparatus
HPLC-Waters Model NO.2690/5 series Compact System is Consisting of Inertsil-C8 column. Electronic balance (SARTORIOUS), Sonicator (FASTCLEAN), Mortar and pestle, 100 mL and 50 mL volumetric flasks, 100 mL beakers, 5 mL pipettes.
Materials
The tablet of Losartan potassium (25 mg) and Hydrochlorthiazide (12.5 mg) was purchased in retail pharmacy, Coimbatore.
Reagents
Acetonitrile (AR Grade), Sodium dihydrogen orthophosphate (AR Grade) Dipotassium hydrogen ortho phosphate (AR Grade), Potassium Dihydrogen ortho phosphate (AR Grade), Water (HPLC Grade), Ortho phosphoric acid (HPLC Grade).
Preparation of standard stock solution
Standard solution: Weigh accurately 40 mg of Losartan Potassium WRS and 20 mg of Hydrochlorothiazide WRS into a 200 mL volumetric flask. Dissolve in 100 mL of diluent and dilute with Buffer A to volume. Pass a portion of the solution through a 0.45 μm nylon membrane filter discarding the first 2 mL.
Sample stock solution: Transfer 10 tablets into a 250 mL volumetric flask and add 210 mL of diluent. Mix well and mechanically shake or stir until the solid is dispersed. Dilute with Buffer A to volume and sonicate.
Sample solution: Transfer 5 mL of sample stock solution into a 25 mL volumetric flask, add 5 mL of Acetonitrile and then dilute to volume with Buffer A. Pass a portion of the solution through a 0.45 μm nylon membrane filter discarding the first 2 mL perform in duplicate.
Optimized chromatographic conditions:
Column: Nucleodur, C8, 150 × 3.9 mm, 5 μ
Detector wavelength: 280 nm
Flow rate: 1.0 mL/minute
Load: 20 μL
Mobile phase: Buffer: Acetonitrile (7: 93)
Method development
To saturate the column, mobile phase was pump for regarding 20 min so to induce the bottom line corrected. Standard calibration lines were created for each drug. A series of aliquots were prepared from the above stock solutions to get the concentrations 50-150 μg/ml for Hydrochlorthiazide, 100-300 μg/ml for Losartan potassium using diluents. Inject every concentration 6 times in to the chromatographic system. Every time peak area and retention time was recorded individually for each the medication. Calibration curves are established by taking average peak area on Y-axis and concentration on X-axis individually for both drugs. Regression equations were calculated from the calibration curves, these regression equations is used to calculate drug substance in formulation [5,6].
Method validation
The described method has been validated for linearity, accuracy, precision, and robustness, as per the ICH guidelines.
System suitability
The relative standard deviation of replicate injections of standard preparation is not more than 2.0% for both hydrochlorothiazide and losartan peaks and the tailing factor is not more than 2.5 for losartan peak [7].
Specificity
The term specific generally refers to a method that produces a response for a single analyte only while the term selectivity refers to a method that provides responses for a number of chemical entities that may or may not be distinguished from each other as per ICH. Solutions of standard and sample were prepared as per the test method are injected into chromatographic system [8].
Linearity
The linearity of the method was determined by preparing six different concentrations of both Losartan potassium and Hydrochlorthiazide in the concentration range of 100-300 μg/ml and 50-150 μg/ml. Each solution was prepared in triplicate. The calibration curves were obtained by plotting peak area versus concentration. Linearity was check over the same concentration range on three successive days and the results obtained. Plot a graph of concentration versus area and determine the correlation coefficient square and y-intercept [9].
Precision
Method precision: Prepared six sample preparations individually using single as per test method and injected each solution.
Intermediate precision: Analyst, instrument and day variability
Separately inject standard solution in 6 replicates and the sample solutions and record the peak area for major peaks. Calculate the content of Losartan potassium and Hydrochlorthiazide per tablet in all the six preparations [10].
Accuracy (recovery)
A study of accuracy was conducted. Drug assay was performed in triplicate as per test method with equivalent amount of Losartan potassium and Hydrochlorthiazide into each volumetric flask for each spike level to get the concentration of Losartan potassium and Hydrochlorthiazide equivalent to 50%, 100% and 150% of the labeled amount as per the test method. The average % recovery of Losartan potassium and Hydrochlorthiazide were calculated.
Robustness
The robustness of an analytical procedure is a measure of its capacity to remain unaffected by small, but deliberate variations in method parameters and provides an indication of its reliability during normal usage. Make slight variations in wavelength, flow rate, mobile phase composition, pH of the buffer and check the system suitability under each variable parameter [11].
Filter integrity
Filter integrity is carried out to determine the compatibility of sample solutions with various filters. Prepare the sample solution as given under the method of analysis. Centrifuge 10 mL of the solution and inject the supernatant liquid. Filter the solution through 0.45 μm nylon membrane filter, discarding the first few mL. Inject the filtered sample. Similarly filter the solution through 0.45 μm PTFE and PVDF membrane filters, discarding the first few mL. Inject the filtered samples. Compare the areas obtained for the filtered samples against the centrifuged sample.
Results and Discussion
Optimized chromatographic conditions
Reversed phase liquid chromatography in isocratic mode with mobile phase of methanol and water, acetonitrile and water are used in different combinations could not retain HCT satisfactorily (retention time about 4 min). Many attempts to retain HCT for longer time by increasing the aqueous phase of mobile phase resulted in very retention time greater than 30 minutes of LOS.
Further study was carried out using mobile phase of increased aqueous portion and heating the column to bring down the retention time of LOS, but this resulted in lower retention time (1.2 minutes) of HCT. Thus adequate separation of HCT and LOS became critical [12].
So it was go for gradient elution with mobile phase of higher aqueous phase in the beginning to retain HCT for longer time and gradually decreasing the aqueous portion to bring down the retention time of LOS. Different combinations of time and mobile phase composition were tried during optimization of gradient method and the one which is given in chromatogram was found to resolve HCT and LOS satisfactorily [13-15].
Most of all reported HPLC methods till date use C-8 or C-18 columns. Most of these use Complex mobile phase compositions. Hence, attempts were directed towards development of a Simple and better method on commonly used Nucleodur-C8, column with good resolution. Different logical Modifications were tried to get good separation among the drugs and the degraded products. These changes included change in mobile phase composition in gradient modes on different HPLC columns. The best peak shape and maximum separation was achieved with mobile phase composition of Acetonitrile:buffer (7:93), peak symmetry and reproducibility were obtained on Nucleodur-C8, 150 × 3.9 mm, 5 μ Column. The optimum wave-length for detecting the analyte was found to be 280 nm, a flow rate of 1.0 ml/min yielded optimum separation and peak symmetry. Chromatogram of Losartan potassium and Hydrochlorthiazide is shown in Figure 3 and optimized chromatographic condition is shown in Table 1
| Parameters | Method |
|---|---|
| Stationary phase (column) | Nucleodur-C8(150 × 3.9 mm, 5 |
| Mobile phase | Acetonitrile: Buffer (7:93) |
| Flow rate (ml/min) | 1.0 ml/min |
| Run time (minutes) | 10 min |
| Column temperature (°C) | 35(°C) |
| Volume of injection loop (0 l) | 20 |
| Detection wavelength (nm) | 280 nm |
Table 1: Optimized chromatographic conditions
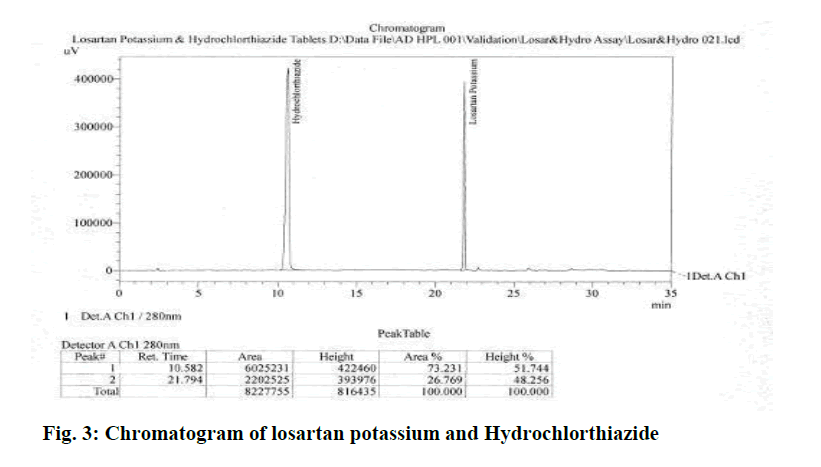
Figure 3: Chromatogram of losartan potassium and Hydrochlorthiazide
System suitability and specificity
Relative standard deviation of the areas of losartan potassium is 0.09% and Hydrochlorthiazide is 0.10%. There is no interference of the placebo. Hence the method is specific.
Linearity
The correlation coefficient for hydrochlorthiazide was found to be 0.9996 and losartan potassium was found to be 0.9999, which complied with the prescribed limit of ICH guidelines (NLT 0.999). Thus the method is said to be linear in the concentration range of 50-150 μg/ml for hydrochlorhiazide and 100-300 μg/ml for losartan potassium (Table 2). The Regression results indicate that method was linear in the concentration range studied and can be used for detection and quantification of hydrochlorthiazide and losartanpotassium in very wide concentration range for Hydrochlorthiazide and losartanpotassium respectively (Figures 4 and 5).
| Drugs | LOS | HCT |
|---|---|---|
| Concentration range (mcg/ml) |
100-300 | 50-150 |
| Slope | 7302 | 40041 |
| Correlation coefficient | 0.9999 | 0.9996 |
| Correlation coefficient square | 0.9999 | 0.9996 |
Table 2: Linear regression data for calibration curves
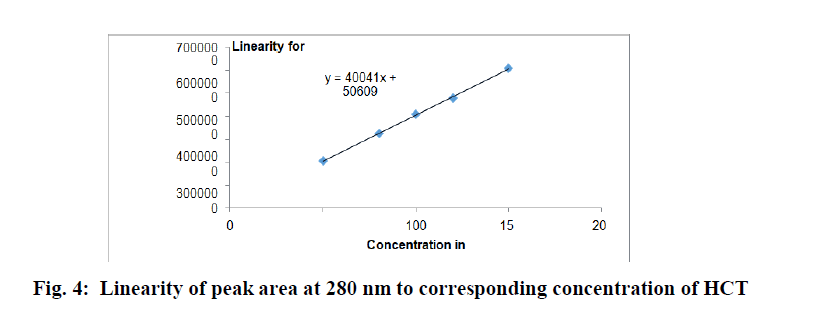
Figure 4: Linearity of peak area at 280 nm to corresponding concentration of HCT
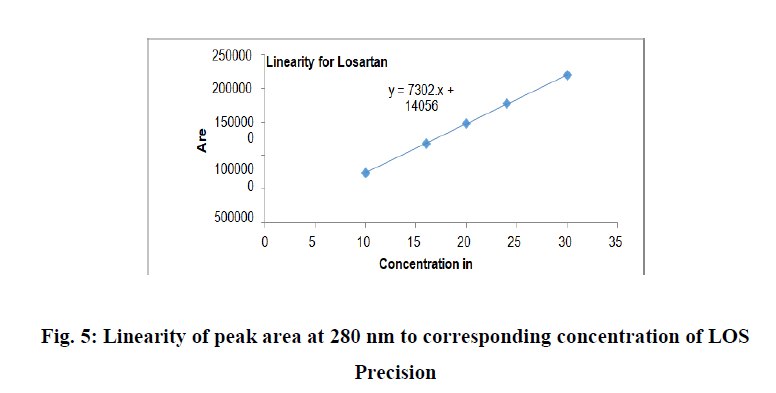
Figure 5: Linearity of peak area at 280 nm to corresponding concentration of LOS Precision
System precision: The relative standard deviation of the areas of Losartan potassium is 0.09% and Hydrochlorthiazide is 0.10% (Tables 3 and 4).
| S. No. |
Recovery level | Amount added (mg) |
Peak response | Amount recovered (mg) |
Recovery (98.0%-102.0%) | Mean and RSD |
|---|---|---|---|---|---|---|
| 1 | 50 | 62.26 | 1985581 | 62.43 | 100.28 | Mean=100.42% RSD (NMT 2.0%)=0.40% |
| 2 | 50 | 61.86 | 1984587 | 62.40 | 100.88 | |
| 3 | 50 | 62.46 | 1988418 | 62.52 | 100.10 | |
| 4 | 100 | 125.11 | 3971147 | 124.87 | 99.81 | Mean=99.23% RSD (NMT 2.0%)=0.61% |
| 5 | 100 | 125.61 | 3954030 | 124.33 | 98.60 | |
| 6 | 100 | 125.31 | 3971989 | 124.89 | 99.28 | |
| 7 | 150 | 187.07 | 6032203 | 189.67 | 101.00 | Mean=101.12% RSD (NMT 2.0%)=0.35% |
| 8 | 150 | 187.37 | 6032585 | 189.69 | 100.84 | |
| 9 | 150 | 186.47 | 6044389 | 190.06 | 101.53 |
Table 3: Recovery result of Hydrochlorthiazide
| S. No. |
Recovery level | Amount added (mg) |
Peak response | Amount recovered (mg) |
Recovery (98.0%-102.0%) | Mean and RSD |
|---|---|---|---|---|---|---|
| 1 | 50 | 125.36 | 734494 | 125.33 | 99.98 | Mean=100.36% RSD(NMT 2.0%)= 0.37% |
| 2 | 50 | 125.06 | 735580 | 125.52 | 100.37 | |
| 3 | 50 | 125.16 | 738782 | 126.06 | 100.72 | |
| 4 | 100 | 249.42 | 1442439 | 246.13 | 98.68 | Mean=98.70% RSD(NMT 2.0%)= 0.05% |
| 5 | 100 | 250.02 | 1445714 | 246.69 | 98.67 | |
| 6 | 100 | 248.93 | 1440693 | 245.84 | 98.76 | |
| 7 | 150 | 373.99 | 2193315 | 374.26 | 100.07 | Mean=100.89% RSD(NMT 2.0%)= 0.80% |
| 8 | 150 | 374.48 | 2214357 | 377.85 | 100.90 | |
| 9 | 150 | 377.87 | 2251938 | 384.27 | 101.69 |
Table 4: Recovery result of losartan potassium
Method precision: % RSD of Losartan potassium and hydrochlorthiazide 0.87% and 1.03% respectively. The RSD for the six Assay determinations is not more than 2.0% (Table 5).
| S. No. | Sample ID | Content of Hydrochlorothiazide mg/tab |
Content of Losartan potassium mg/tab |
|---|---|---|---|
| 1 | Sample-1 | 12.50 | 25.25 |
| 2 | Sample-2 | 12.43 | 25.19 |
| 3 | Sample-3 | 12.53 | 25.14 |
| 4 | Sample-4 | 12.60 | 25.35 |
| 5 | Sample-5 | 12.80 | 25.71 |
| 6 | Sample-6 | 12.63 | 25.55 |
| Average | 12.58 | 25.36 | |
| RSD | 1.03% | 0.87% | |
Table 5: Data for repeatability (Method precision)
Solution stability and filter integrity
The deviation in areas for standard and test solutions passes the acceptance criteria after 48 hours. Hence the solutions are stable up to 48 hours.
Robustness
Robustness was studied for the variation of mobile phase flow rate 1.0 ± 0.1mL/min and wavelength 280 nm. After change in the experimental condition there was no significant loss of sensitivity, selectivity and peak parameters. So the method is said to be robust for deliberate change of wavelength and flow rate (Table 6).
| Parameters | Variation | RSD NMT 2.0% |
Tailing factor of Losartan peak NMT 2.5 | |
|---|---|---|---|---|
| Hydrochlorothiazide | Losartan Potassium |
|||
| Change in wavelength | 278 nm | 0.63% | 0.74% | 1.29 |
| 282 nm | 0.70% | 0.85% | 1.29 | |
| Flow rate | 0.9 mL/min | 0.23% | 0.70% | 1.40 |
| 1.1 mL/min | 0.34% | 0.42% | 1.43 | |
Table 6: Data for robustness
Conclusion
The proposed method is precise, accurate for the simultaneous determination of HCT and LOS from tablet. It is also a stability indicating method and hence can be easily and conveniently adopted for routine quality control analysis and also bioassay.
References
- Gerber F, Krummen M, Potgeter H, Roth A, Siffrin C, Spoendlin C. Practical aspects of fast reversed-phase high-performance liquid chromatography using 3 μm particle packed columns and monolithic columns in pharmaceutical development and production working under current good manufacturing practice. J Chromatogr A. 2004;1036(2):127-133.
- Aguilar MI, Hearn MT. High-resolution reversed-phase high-performance liquid chromatography of peptides and proteins. Methods enzymol. 1996;270:3-26.
- Mant C. T, Hodges R. S. Analysis of peptides by high performance liquid chromatography. Meth Enzymol. 1996;271:3-50.
- Purcell, A. W., Aguilar, M. I., Hearn, M. T. W. Conformational effects in the RP-HPLC of polypeptides. II: The role of insulin A and B chains in the chromatographic behaviour of insulin. J Chromatogr. 1995;711:71-79.
- Richards, KL, Aguilar, MI, Hearn MT, W. The effect of protein conformation on experimental bandwidths in RP-HPLC. J Chromatogr. 1994;676:33-41.
- Oroszlan P, Wicar S, Teshima G, Wu SL, Hancock WS, Karger BL. Conformational effects in the reversed-phase chromatographic behavior of recombinant human growth hormone (rhGH) and N-methionyl recombinant human growth hormone (Met-hGH). Analytical chemistry. 1992;64(14):1623-1631.
- Shiwen L, Karger BL. Reversed-phase chromatographic behavior of proteins in different unfolded states. Journal of Chromatography A. 1990;499:89-102.
- Willard HH, Merritt LL, Dean JA, Settle FA. Instrumental methods of analysis, CBS Publishers and Distributors. New Delhi. 1986;580:626.
- Connors AK. A Text Book of Pharmaceutical Analysis. A Wiley Interscience publication, 3rd edition 2005; 373-400.
- Ahuja S. High-pressure liquid chromatography. Comprehensive Analytical Chemistry. 2006;47:485-559.
- Biosciences A. Reversed Phase Chromatography. Principles and Methods. 2013:6-8.
- Dorsey JG, Cooper WT. Retention mechanisms of bonded-phase liquid chromatography. Anal Chem. 1994;66(17):857-867.
- Tanford C. Physical chemistry of macromolecules. Wiley.1961.
- Singh R. HPLC method development and validation-an overview. Journal of Pharmaceutical Education & Research. 2013;4(1).
- Snyder LR, Kirkland JJ, Glajch JL: Practical HPLC Method Development. 2nd ed. 2001.

